
Does Raising Cash Using the 200-Day Moving Average Reduce Losses?
We tested a rule that raises cash to at least 60% when both the S&P 500 and Nasdaq-100 fall below their 200-day moving averages. It added little because the existing rules already held substantial cash. This simplified test has limits.
When the market falls, can you limit losses by reducing stocks and raising cash? AlpAI tested a rule that treats a stock index falling below its average of the past 200 trading days as a signal (a condition for raising cash). This article reports what that added rule changed in a simulated account, and where the test stops being informative.
In this test, adding the rule barely changed results. By the time the signal appeared, the existing trading rules had already left a lot of cash. We also tested a condition that triggers the signal earlier. It improved the 2020 result, but the annualized return over the full period fell.
This is an exploratory calculation run on 2026-09-26. It does not trace actual orders. It is a simplified calculation that scales the next day's gain or loss to match the cash ratio (the share of the simulated account held in cash). Additional costs, fill-price slippage and cash interest are not included.
The signal is “both indexes below their 200-day moving averages”
The 200-day moving average is the average of the closing prices over the past 200 trading days. This test uses two ETFs that track the S&P 500 and the Nasdaq-100, respectively, and defines the signal as both closing prices being below their 200-day moving averages. It is not a rule that raises cash after a single day's decline.
When this signal appears, we consider holding 60% or more of assets in cash. If 60% or more is already in cash at the close on the day the signal appears, no additional change is made.
We compared results by scaling the next day's gain or loss, rather than reproducing orders
First, using the existing trading rules, including sales triggered by stop-losses and maximum holding periods, we calculated daily account value and cash ratio for 2020–2025. We call this “without the additional rule.”
In “with the additional rule,” if cash was below 60% at the close on the day the signal appeared, we recalculated the next day's gain or loss from price movement, scaled down to the size it would have been with 60% in cash. We did not retrace actual sell or buy-back orders. In this calculation, raising cash can shrink not only losses but also the gains that follow.
What we compare is the presence or absence of this additional rule. We calculated it for four start dates, each shifted by 5 trading days. Additional trading commissions and fill-price slippage are not included, and cash interest is set to 0.
Full-period results were nearly the same with and without the additional rule
These are results for 2020–2025. Each metric is the average of the values calculated for the four start dates.
| Condition | Average annualized return | Average maximum drawdown |
|---|---|---|
| Without additional rule | 8.93% | -14.62% |
| With additional rule | 8.94% | -14.52% |
Maximum drawdown here is the largest percentage decline of the simulated account value from its prior peak. The -14.62% and -14.52% figures are averages across the four start dates. They do not mean that the drawdown in every calculation fell within this range.
Both annualized return and maximum drawdown changed only slightly with the added rule. However, this does not prove that the rule has no effect in actual trading, or that the two conditions are equivalent.
Only a limited number of days changed in the drawdown periods
We look at three drawdown periods: 2020, 2022 and 2025. The peak-to-trough declines of the ETF tracking the S&P 500 were, in order, 33.7%, 24.5% and 18.8%. The table below shows calculations using AlpAI's trading rules, not the ETF's performance.
| Year | Without additional rule | With additional rule | Days applied |
|---|---|---|---|
| 2020 | +4.78% | +4.78% | 0 days |
| 2022 | -7.48% | -7.51% | 3 days |
| 2025 | +17.16% | +17.01% | 14.5 days |
Returns and days are averages across the four start dates. 14.5 days does not mean that half a day was traded in a single calculation.
In 2020, there were no days on which the additional rule changed gains or losses, and in 2022 and 2025 it changed only some days. There were also days in 2023 that met the condition, but this table compares the three drawdown periods above.
Cash was already high when the signal appeared
For 2 of the 4 start dates, we checked the cash ratio on the days the signal appeared.
| Year | Simulated cash ratio on signal days |
|---|---|
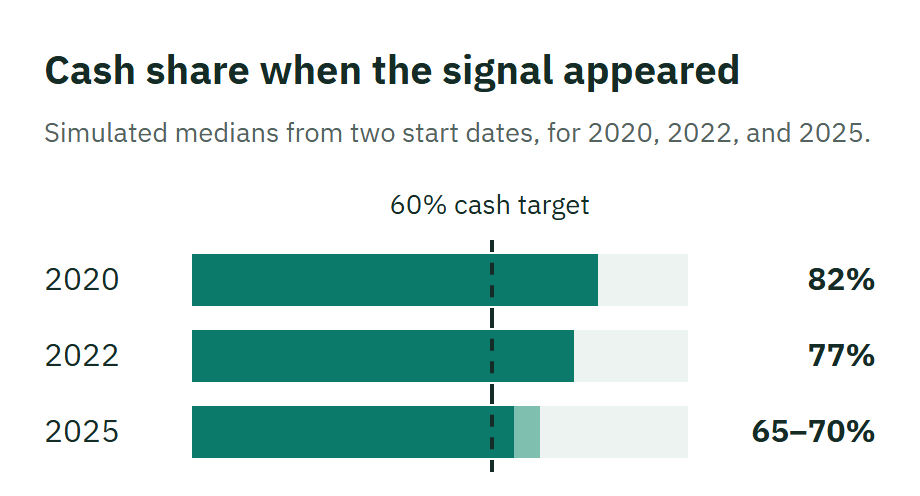
| 2020 | 70–88% (median 82%) |
| 2022 | Median 77% (minimum 35%) |
| 2025 | Median 65–70% (minimum 27%) |
The medians were above 60%, but cash was not at 60% or more on every day. In 2022 and 2025 there were days when it fell below 60%, and on those days the additional rule changed the calculation.
In the 2020 calculation, sales triggered by stop-losses and maximum holding periods progressed while stock prices were falling, so cash rose first. Both indexes fell below their 200-day moving averages on March 11, and the signal ended on April 8.
| 2020 | Simulated cash ratio |
|---|---|
| Feb 18 | 15–18% |
| Mar 2 | 55–61% |
| Mar 10 | 70–74% |
The existing sell rules had already reduced the room for this additional rule to act. This is the result of the particular combination of rules used here, not the effect of raising cash in general.
Adding signals improved 2020 but lowered the full-period result
To raise cash earlier, we tested a version that also triggers the signal on days when the VIX is above 25, in addition to the earlier condition. The VIX is an index of expected volatility for the S&P 500. The calculation is the same: once the signal appears, cash is raised to 60% or more.
In the table, “Below average” is the condition in which both indexes are below their 200-day moving averages. “Add VIX condition” triggers the signal when either both indexes are below their averages or the VIX is above 25.
| Signal | Annualized return | Maximum drawdown | 2020 |
|---|---|---|---|
| Without additional rule | 8.93% | -14.62% | +4.78% |
| Below average | 8.94% | -14.52% | +4.78% |
| Add VIX condition | 8.62% | -14.58% | +8.15% |
All figures are averages across the four start dates. Adding the VIX condition changed the 2020 result from +4.78% to +8.15%. On the other hand, the annualized return for 2020–2025 as a whole fell from 8.93% to 8.62%.
For the years other than 2020 and 2022, that is 2021, 2023, 2024 and 2025, the cumulative result from chaining the daily gains and losses was 8.85 percentage points lower than without the additional rule. This is an average across the four start dates, not a simple sum of the yearly differences.
Better results in a single drawdown period do not mean results will be better over the full period.
The period of the largest drawdown also differed by start date
| Start date | Maximum drawdown in that calculation | Peak-to-trough period |
|---|---|---|
| Start date 1 | -17.4% | 2021-09 to 2023-05 |
| Start date 2 | -14.7% | 2021-11 to 2023-05 |
| Start date 3 | -13.6% | 2021-01 to 2021-03 |
| Start date 4 | -12.8% | 2020-02 to 2020-03 |
For 3 of the 4 start dates, the largest drawdown occurred between 2021 and 2023. From this period alone, we cannot separate whether the cause was the overall market, individual stocks or the trading rules.
What is still missing to judge the effect of the additional rule
What this calculation shows is that when the existing sell rules have already built up a lot of cash, an additional rule requiring 60% or more in cash has little room to change gains or losses. Even when an earlier signal was added, the 2020 improvement did not carry through to the full period.
This calculation alone cannot decide whether the additional rule should be used in actual trading. Nor did it examine the effectiveness of raising cash in general.
To evaluate the additional rule in actual trading, the comparison would need matched conditions, including prices at times when orders could actually be executed, the movement of funds after sales and buy-backs, and additional costs. This is the next check needed, not something already confirmed in this calculation.
Assumptions and limitations of the calculation
- This is an exploratory calculation using historical data, not actual trading performance.
- The universe is the constituents of the S&P 500 and the Nasdaq-100 as of the snapshot used in the study. Stocks that previously dropped out of the indexes are not included, which can bias the results.
- The calculation of the existing rules treats trades as executed at the closing price on the day the condition is checked. The additional rule also adjusts the next day's gain or loss using information available at that closing price. It does not reproduce orders that could actually have been executed at that price.
- Additional trading commissions, fill-price slippage and cash interest are not included. We do not describe the results as an upper or lower bound on the effect.
- The four start dates include overlapping periods and are not four independent runs. The three periods discussed in the text also cannot be used alone to judge the effect in all kinds of declines.
This article shares the method and limitations of the calculation. It does not recommend that readers use a 60% cash ratio or any particular trading timing. Past calculations do not guarantee future results.