
Testing Minervini's Trading Method: A 16-Year Backtest
We turned US trader Mark Minervini's method into fixed trading rules and tested them on 16 years of historical data. Both methods we could compare trailed the S&P 500-tracking ETF.
If you buy a rising stock when it breaks above the top of its consolidation range on heavy volume, and keep your losses small, can you beat the index? That is the approach published by US trader Mark Minervini. We converted it into fixed numeric rules to find out, so that self-directed investors can see how a rules-based version compared with an index ETF.
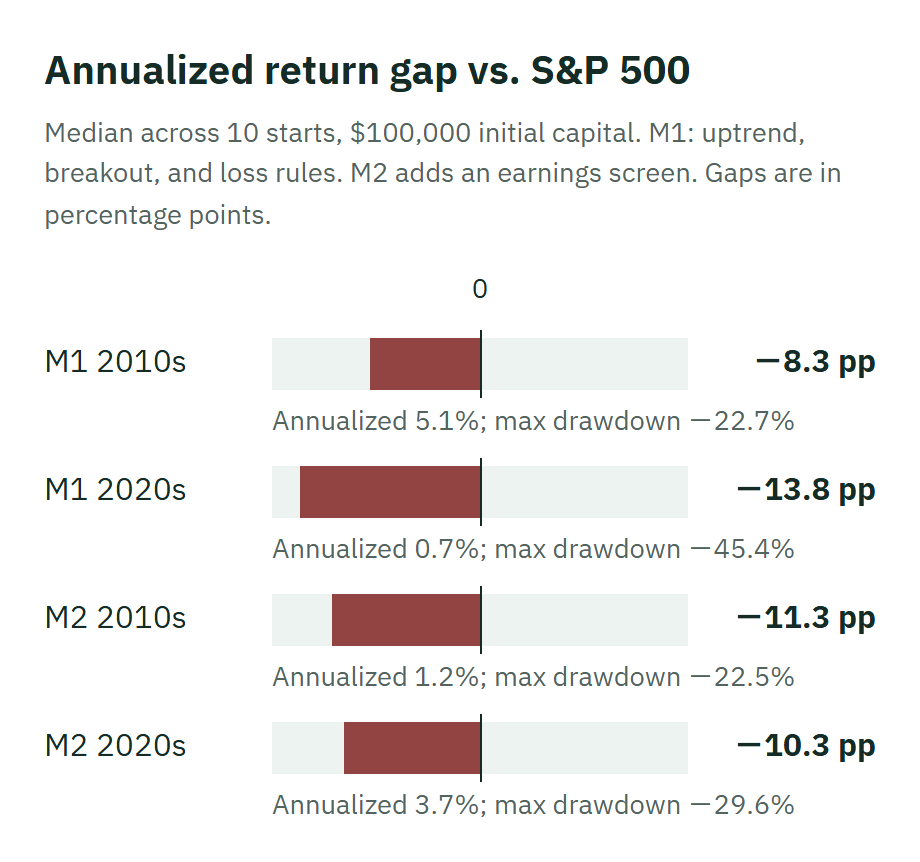
We tested two periods within 2010–2025. In both, the two methods we could compare came in below the S&P 500-tracking ETF (SPY, dividends included). The median gap across 10 start dates was about 8–14 percentage points a year. A separate test of breakouts alone also found no evidence of beating the index under these conditions.
This is not a reproduction of Minervini's actual trades. We converted conditions such as price and volume into numeric rules so that anyone running them would get the same result.
The trading rules and conditions we tested
We could compare the results of the following two methods. We also tested methods that add a condition approximating VCP (M3 and M4), but too few cases met the condition to judge whether it had any effect.
- Base method (M1): When a stock meets the uptrend conditions (the Trend Template) and the overall market is not in a downtrend, buy at the next day's open if the stock closes above the top of its consolidation range (the pivot) on heavy volume. Limit the loss on each trade to 1.25% of assets. Sell half at +20%, and sell the rest when the price falls below its 50-day moving average.
- Method with earnings conditions (M2): M1 plus earnings conditions. This limits purchases to stocks with earnings-per-share growth of at least 20%, revenue growth of at least 15%, and ROE (return on equity) of at least 17%.
We also added a rule approximating Minervini's signature pattern, the VCP (volatility contraction pattern: a consolidation in which the price swings gradually narrow).
The conditions are as follows.
- We split the test into 2010–2019 and 2020–2025. To pass, a method had to meet the criteria in both periods and at both $100,000 and $200,000 of starting capital, with the lower bound of the 95% interval of the difference from the S&P 500 above 0 and a maximum drawdown (the largest fall from a prior peak) shallower than −40%. A method does not pass merely because its representative annualized figure is above the index.
- The stocks are US stocks that, at the time, had a closing price of at least $10 and a 50-day average dollar trading volume of at least $20 million. Stocks that were later delisted are included. Testing only stocks that survived would bias the results toward looking better.
- Starting capital is $100,000. We ran the calculation with 10 staggered start dates and show the median. With $200,000, the results were nearly the same.
- Trading costs are included.
- We recorded the trading rules and pass criteria before testing. We did not change the trading rules after seeing the results.
Results: Both methods we could compare trailed the S&P 500 in both periods
| Method | Annualized return | Maximum drawdown | Difference vs. S&P 500 |
|---|---|---|---|
| Base method (M1) | 5.1% | -22.7% | -8.3 percentage points |
| Method with earnings conditions (M2) | 1.2% | -22.5% | -11.3 percentage points |
| Method | Annualized return | Maximum drawdown | Difference vs. S&P 500 |
|---|---|---|---|
| Base method (M1) | 0.7% | -45.4% | -13.8 percentage points |
| Method with earnings conditions (M2) | 3.7% | -29.6% | -10.3 percentage points |
The difference vs. the S&P 500 is the median across 10 start dates. The range of the difference (95% interval) is wide: for M1 it was -17.0 to +0.2 percentage points in the 2010s and -29.3 to +1.7 percentage points in the 2020s. For M2 in the 2010s alone, even the upper end of the interval was below 0.
Adding the earnings conditions made the 2020s drawdown shallower (from -45.4% to -29.6%). On the other hand, the 2010s annualized return fell (from 5.1% to 1.2%).
There were years with big gains. M2 returned +54.6% in 2024. But that is the only year in 16 with a gain above +50%. The losing years were also large: M1 returned -21.1% in 2021 and M2 returned -11.1% in 2022. Most of the results came from a small number of stocks. Excluding the top 5 stocks, M1's annualized return in the 2020s was -7.7%.
We could not measure the version with VCP added. Our approximation (price range and volume both shrinking across three consecutive 15-day segments) held in only 3 of the 557 purchases M2 made, so the account stayed almost entirely in cash. Splitting by a fixed number of days does not line up with the actual peaks and troughs of a pullback. This is not an evaluation of VCP itself. We also tried identifying the pattern from its peaks and troughs, but the difference from other breakouts was not large enough to draw a conclusion.
Even when we isolated the breakout signals alone, we could not confirm outperformance of the index
From here on, this is a comparison separate from the whole account. We collected the signals that met M1's breakout condition at the close, regardless of whether the account actually bought them, and compared the after-cost results of buying at the next day's open with SPY. The 95% interval reflects the uncertainty of the estimate, and a positive result remains possible.
The values in the table are after-cost excess returns versus SPY. They are not whole-account returns.
| Period | After 20 trading days | After 60 trading days |
|---|---|---|
| 2010–2019 | −0.1% | −0.2% |
| 2020–2025 | −0.4% | −1.2% |
There were about 17,500 breakout signals in the 2010s and about 11,500 in the 2020s. We also compared them with stocks that met the other conditions on the same day but did not break out, and found no advantage for breakouts. The differences after 20 trading days are −0.12 percentage points and −0.13 percentage points, respectively, and both 95% intervals straddle 0.
Next is a comparison of purchase timing. Selecting only stocks that, as we learned afterward, also held the breakout at the close, we compared buying near the same-day breakout level (the pivot) with buying at the next day's open.
| Period | Same-day purchase − next-day purchase (after 20 trading days) |
|---|---|
| 2010–2019 | +1.5 percentage points |
| 2020–2025 | +2.2 percentage points |
During trading hours, you cannot know which stocks will still be above the breakout level at the close. A comparison covering all cases that crossed the pivot intraday is separate from the after-the-fact selection above. The gap for a group chosen afterward cannot be interpreted as a profit available in actual trading.
| Period | Difference vs. SPY for all cases (after 20 trading days) |
|---|---|
| 2010–2019 | −0.2% |
| 2020–2025 | −0.5% |
We also examined stop-losses. Among M1 trades that were stopped out, the share that would have ended in a profit had they been held to 60 days was 33% in 2010–2019 and 35% in 2020–2025. This includes sales made after the stop level was raised to the purchase price. However, the fact that some trades recovered after being stopped out does not show that changing the stop would improve whole-account results, nor that the breakout signal has any effect.
How this differs from Minervini's own approach
- Minervini buys as the price crosses the pivot during trading hours. This test confirms the breakout on the daily close and buys the next day.
- In this test, the way stocks are selected is fixed to numeric conditions set in advance. It does not reproduce the decision process by which Minervini actually chose each stock.
- The study notes that Minervini also used short selling and borrowing in the 2021 trading competition. This test uses neither.
In other words, what we tested is the "trading rules written in the book," not "Minervini the person."
What we found
M1 and M2, which specify everything from the entry conditions to the stop-loss, partial profit-taking and the end of the holding, fell below the S&P 500 in both 2010–2019 and 2020–2025, by the median of the 10 start dates in this test. On the other hand, for the method with the VCP approximation added, too few cases met the condition to judge the method's merits. These results cannot be equated with Minervini's own trading or with the performance of the method in general.
After this study, we also tested intraday entry and the rules for selling and holding after purchase under separate conditions. Because each study has a different scope and different conditions, we do not retroactively treat the conclusions from those studies as the cause of the results in this article.
This article presents estimates calculated from historical data. They are not AlpAI's actual account performance. It does not recommend trading any specific stock or method.