
Do Stock-Price Regularities Still Pay After Trading Costs?
We tested four stock-price regularities reported in academic papers, including trading costs and splitting the data into separate periods. None met the pass criteria set in advance, and the four fell short for different reasons.
Stock-price anomalies are regularities that are hard to explain with theory but appear repeatedly in past data. Can the ones known from academic papers be turned into profit as they are? We tested four of them, with separate periods and cost conditions: overnight holding, the turn of the month, US monetary policy announcement days, and newly listed stocks.
No method met the pass criteria set in advance for this study.
However, the four methods did not fall short for the same reason. For one, costs were heavy. For another, the evidence did not establish an excess return over the benchmark even before costs. For a third, the second-half average was negative. The sections below keep these cases apart. We do not conclude that "all the regularities have disappeared."
The four stock-price regularities tested
Overnight holding
Buy SPY at the close (the end of the day's trading) on each trading day and sell it at the next trading day's open (the start of trading).
Periods: two periods, 1994-01 to 2012-12 and 2013-01 to 2025-12. Tested on 2026-10-10.
Turn of the month
Hold on the last trading day of each month and the first 3 trading days of the next month (4 trading days in total).
Period: 2000 to 2025. Tested on 2026-10-11.
FOMC announcement days
Hold on announcement days of the US monetary policy meeting (FOMC): from the close of the trading day before the announcement to the close of the announcement day.
Period: 2012 to 2025. Tested on 2026-10-11.
Newly listed stocks (IPOs) before research coverage begins
Treat about 25 days after listing as the brokerage's research start date, and buy just before it.
Period: 512 candidates that listed in 2010 to 2025. Tested on 2026-10-21.
For overnight holding, the turn of the month, and FOMC announcement days, we used the S&P 500 ETF (SPY); for IPOs, we compared each individual stock's price moves with SPY. Price series reflect dividends. Because the periods and comparison methods differ, we did not build a common performance figure by averaging the four results.
Each of the four is a separate test with pass criteria set before the results were seen.
For overnight holding, and for the reference calculation that holds only on the turn-of-the-month and FOMC target days, we assumed a one-way spread of 1bp (0.01%) and a commission of $0.005 per share with a $1 minimum. The main judgment for the turn of the month and FOMC is the difference in average returns versus other days, before costs. The IPO cost conditions are shown later.
The annualized figures below are returns converted to a compounded one-year basis. Differences between annualized figures are expressed in percentage points. The 95% interval is the range obtained with a bootstrap (a method that randomly resamples the data and repeats the calculation to measure how much the result varies), resampling month-by-month blocks 10,000 times. An interval that spans 0 cannot clearly establish the direction of the difference.
Overnight holding: pre-cost difference from intraday, and post-cost results
The representative paper reporting overnight price moves was published in 2008. The 1994 to 2012 period in this study includes years before publication, and 2013 to 2025 falls after publication. For 1994 to 1999, the pre-cost annualized return was 23.16% for overnight holding and 0.12% for intraday-only holding, a large gap.
The adoption criteria were that the after-cost annualized return stay at 70% or more of buy-and-hold, and that the maximum drawdown be 60% or less of buy-and-hold's. Both had to be met in both periods. Starting capital is $100,000.
Annualized return, and ratio to buy-and-hold
| Period | Overnight, before costs | Overnight, after costs |
|---|---|---|
| 1994-01 to 2012-12 | 10.26% | 2.18% |
| 2013-01 to 2025-12 | 9.09% | 2.82% |
| Period | Buy-and-hold |
|---|---|
| 1994-01 to 2012-12 | 8.00% |
| 2013-01 to 2025-12 | 14.61% |
| Period | After costs ÷ buy-and-hold (criterion: 0.70 or higher) |
|---|---|
| 1994-01 to 2012-12 | 0.272 |
| 2013-01 to 2025-12 | 0.193 |
Comparison of maximum drawdown
| Period | Overnight holding (after costs) | Buy-and-hold |
|---|---|---|
| 1994-01 to 2012-12 | 46.81% | 55.42% |
| 2013-01 to 2025-12 | 29.83% | 33.72% |
| Period | Overnight holding ÷ buy-and-hold (criterion: 0.60 or lower) |
|---|---|
| 1994-01 to 2012-12 | 0.845 |
| 2013-01 to 2025-12 | 0.885 |
In neither period were the annualized-return and drawdown criteria met.
A small one-way cost adds up through daily round trips
With two trades a day, even a one-way cost of 1bp is a burden of about 5 percentage points a year. Once commissions are added, the annualized return lost was 6 to 8 percentage points.
| Period | No costs | Bid-ask spread only |
|---|---|---|
| 1994-01 to 2012-12 | 10.26% | 4.84% |
| 2013-01 to 2025-12 | 9.09% | 3.74% |
| Period | Commission only |
|---|---|
| 1994-01 to 2012-12 | 7.46% |
| 2013-01 to 2025-12 | 8.13% |
| Period | Both applied | Reduction in annualized return |
|---|---|---|
| 1994-01 to 2012-12 | 2.18% | 8.08 percentage points |
| 2013-01 to 2025-12 | 2.82% | 6.27 percentage points |
The overnight-only estimate fell from pre-cost annualized returns of 10.26% and 9.09% to after-cost returns of 2.18% and 2.82%. The bid-ask spread is the price difference between the offer (ask) and bid quotes.
In 1994 to 2012, the criteria were met if costs were not deducted: the annualized return was 1.282 times buy-and-hold's, and the maximum drawdown was 0.592 times. In 2013 to 2025, however, even with zero costs the annualized return was 9.09%, which does not reach 70% of buy-and-hold's 14.61%. The second-period failure cannot be blamed entirely on costs.
The gap between overnight and intraday was smaller in more recent decades
Each row below is a pre-cost annualized return calculated separately, starting from $100,000. They are not one continuous investment chained across the periods.
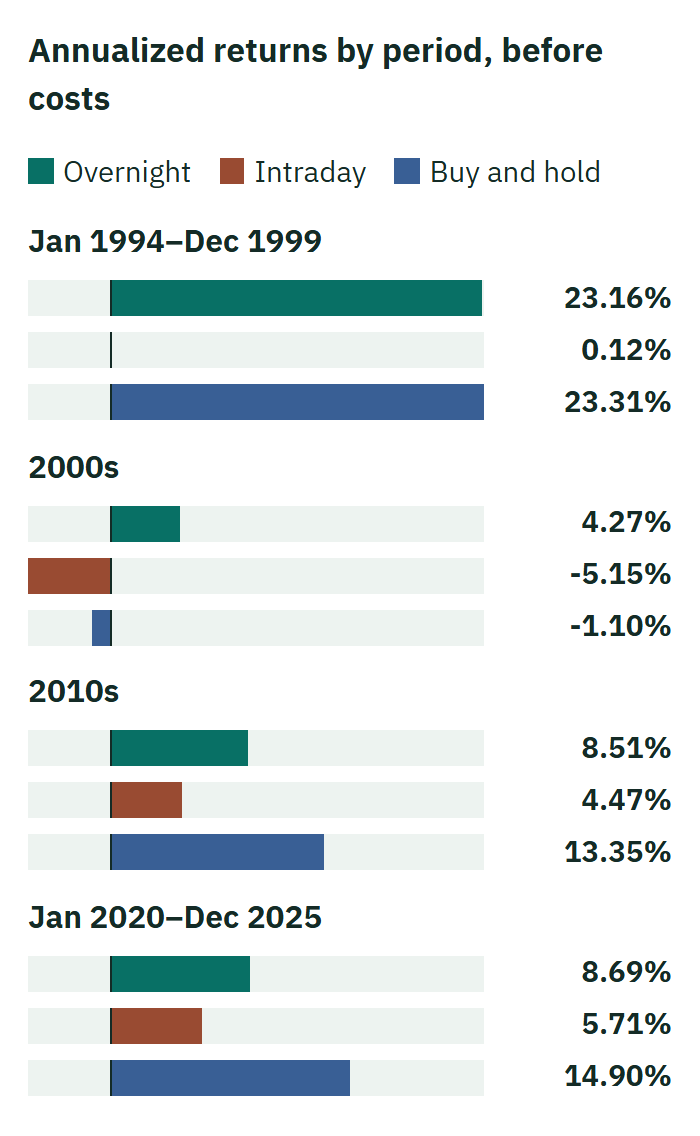
Overnight was higher in every decade, but the gap from intraday narrowed from 23.0 percentage points to 3.0 percentage points.
Look at maximum drawdown and whole-episode gains or losses separately
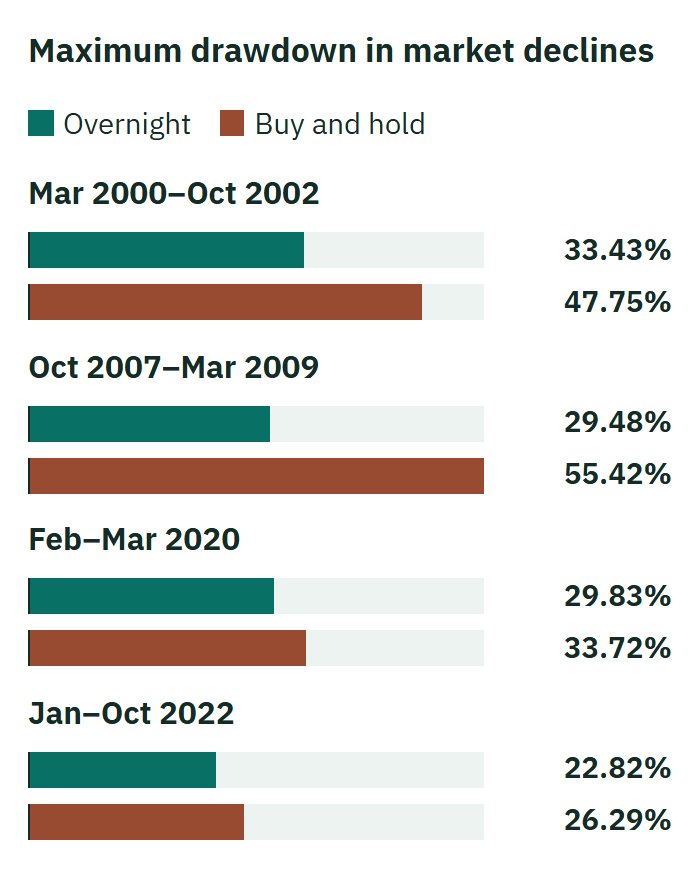
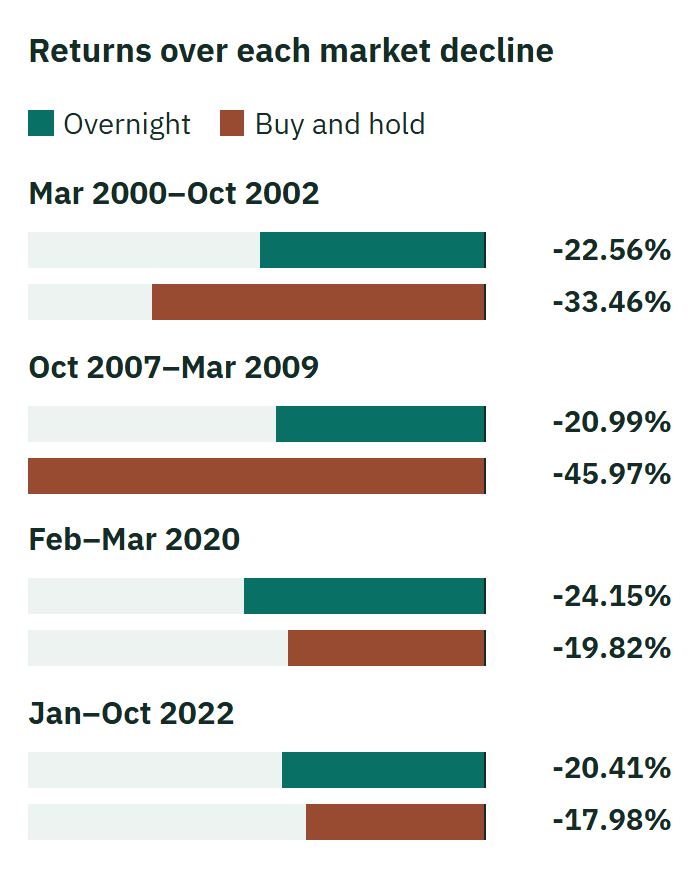
The first 2 episodes are included in the 1994 to 2012 calculation, and the latter 2 in the 2013 to 2025 calculation. In the two older episodes, overnight holding did better on both drawdown and whole-episode results. In 2020 and 2022, however, even though the maximum drawdown was shallower, the return over the episode was worse than buy-and-hold's. On 2020-03-16, overnight holding alone returned −10.4%.
Capital size also matters. Assuming fractional shares can be bought, reducing starting capital to $10,000 makes the $1 minimum commission weigh more heavily; the after-cost annualized return was 1.04% in the first period and −2.28% in the second.
Turn of the month and FOMC: averages were higher, but the difference could not be clearly established
The turn of the month covers the last 1 trading day of the month and the first 3 trading days of the next month; FOMC covers the period from the close of the trading day before the announcement to the close of the announcement day. The difference from other days is the daily return after subtracting the short-term US Treasury rate, in bp.
The criteria were that the average on target days be higher than on other days, that the lower bound of the 95% interval for the difference be above 0, and that the first-half and second-half differences both be positive.
The papers on the turn of the month are from 1988 and 2008. The 2000 to 2025 period used here may partly overlap the 2008 paper's sample period, so it cannot be called a post-publication-only test. The FOMC paper is from 2015 and covers 1994 to 2011; this study used 2012 to 2025, after that sample period.
Turn of the month: daily excess return, bp, before costs
| Period | Average on month-end/month-start days | Average on other days |
|---|---|---|
| 2000 to 2025 | 5.09 | 2.56 |
| 2000 to 2012 | 6.61 | −0.68 |
| 2013 to 2025 | 3.57 | 5.80 |
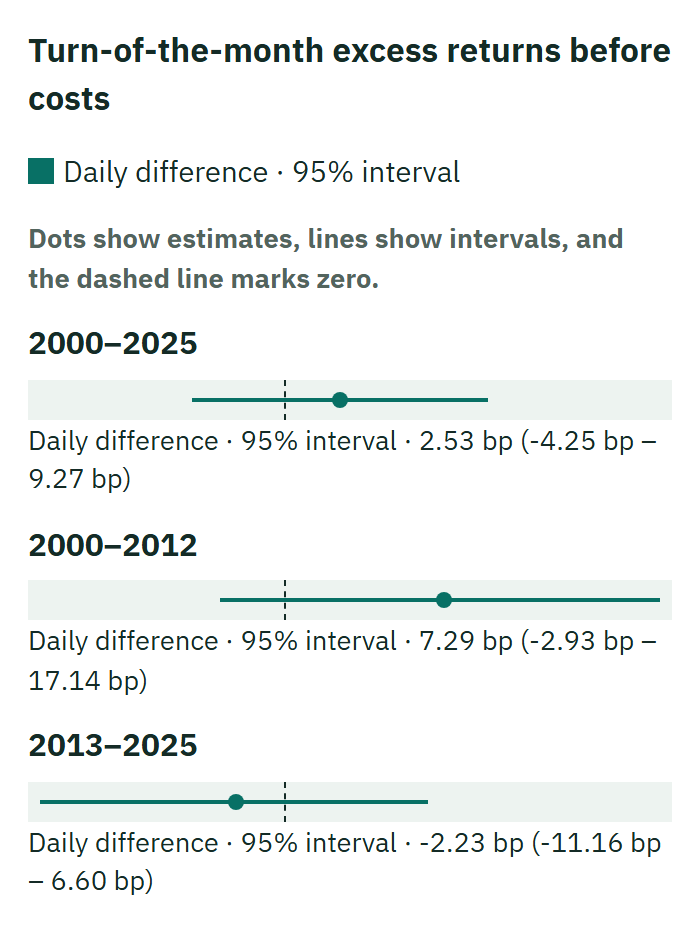
For the full period and the first half, the interval spans 0, and in the second half the point estimate of the difference was also negative. Years with a positive difference were 11 of 26: 7 of 13 in the first half and 4 of 13 in the second half.
In a reference calculation for 1960 to 1999, using the S&P 500 index series including dividends, the difference was +10.12bp [+5.18, +15.13]. Because this period overlaps the papers' sample periods, it was not used in the pass judgment. It is also a different series from SPY, so the narrowing of the difference cannot be treated as a change within one continuous series.
FOMC announcement days: daily excess return, bp, before costs
| Period | Average on announcement days | Average on other days |
|---|---|---|
| 2012 to 2025 (111 announcement days) | 14.87 | 5.13 |
| 2012 to 2018 | — | — |
| 2019 to 2025 | — | — |
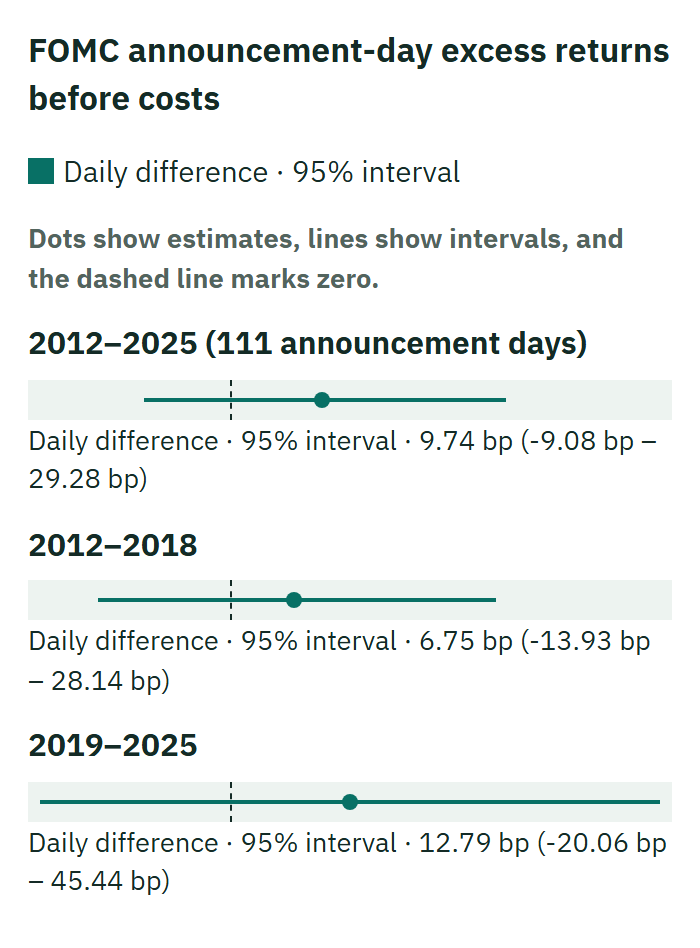
The announcement-day average was higher than on other days, and the first-half and second-half point estimates are also positive. Even so, with 111 observations the interval is wide and spans 0, so an excess return over other days could not be clearly confirmed. Years with a positive difference were also 7 of 14.
Reference calculation holding only on target days
If the account is held in cash on all non-target days, and a one-way spread of 1bp and commissions are deducted, the results are as follows.
| Target and period | Annualized return on target days | Maximum drawdown |
|---|---|---|
| Turn of the month, 2000 to 2025 | 3.78% | −17.96% |
| FOMC announcement days, 2012 to 2025 | 2.55% | −4.05% |
| Target and period | Share of days held |
|---|---|
| Turn of the month, 2000 to 2025 | 19.1% |
| FOMC announcement days, 2012 to 2025 | 3.2% |
| Target and period | Buy-and-hold annualized return | Maximum drawdown |
|---|---|---|
| Turn of the month, 2000 to 2025 | 7.98% | −55.19% |
| FOMC announcement days, 2012 to 2025 | 14.86% | −33.72% |
Drawdowns were shallower, but because the account was in the market for few days, the annualized return fell well below buy-and-hold's. This is a reference calculation, separate from the main test that judges the difference in averages on target days.
IPOs before research coverage starts: the second-half average did not meet the adoption condition
A 2003 paper reported a tendency for buying to come in before underwriter analysts begin research coverage, pushing newly listed stocks up. Here, we treated the first trading day on or after 25 calendar days from the candidate's first day as the research start date. This is not a test that confirmed actual research publication dates.
The sample is 512 mechanically selected candidates from 2010 to 2025. Deals priced under $5 or with small trading value were excluded by rules set in advance. Each trade was $2,500, and a spread that depends on trading value plus a $1 one-way commission were deducted.
For the criterion buying method, we required that the average after-cost difference from SPY exceed +0.5%, that the lower bound of the 95% interval be above 0, and that the first-half and second-half averages both be positive.
The table is anchored on the date treated as the research start date. All trades are at the close, and days are trading days. "Buy 5 days before" is the criterion case: buy 5 days before and sell the next day. "Buy the day before" is a reference calculation: buy the day before and sell the next day. "Buy 10 days after" is a separate comparison: buy 10 days after and sell 16 days after. Each row uses the range of the same 512 candidates for which prices could be compared; the average and interval are the after-cost difference from SPY.
| When to buy | Candidates | Observations |
|---|---|---|
| Buy 5 days before | 512 | 452 |
| Buy the day before | 512 | 439 |
| Buy 10 days after | 512 | 397 |
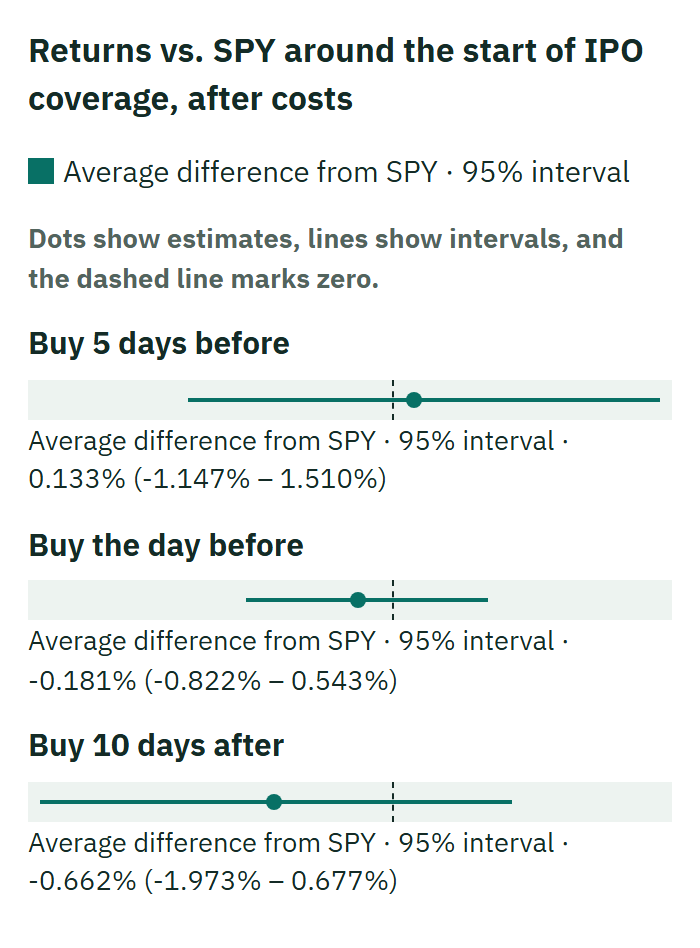
| When to buy | 2010 to 17 | 2018 to 25 |
|---|---|---|
| Buy 5 days before | +0.488% | −0.102% |
| Buy the day before | −0.302% | −0.101% |
| Buy 10 days after | +0.072% | −1.158% |
The criterion case is buying 5 trading days before the date treated as the research start date. The overall average of +0.133% did not reach +0.5%. The first-half +0.488% meets the first-half condition of being greater than 0, but the second-half −0.102% does not. This second-half value triggered the rejection condition set in advance.
The interval spans 0. Falling short of the adoption criteria is different from proving that no effect exists before research coverage begins in general.
A separate reference study: 29 existing style ETFs
We compared 29 ETFs that focus on momentum (stocks with strong recent gains), quality (stocks with high financial quality), value, low volatility, small caps, buybacks, corporate events, trend following and similar themes with SPY over the same period, from each ETF's listing to 2026-10-08.
Six ETFs beat SPY. The one with the largest annualized difference was +4.16 percentage points, and the other 5 were +1.24 percentage points or less. Many others trailed SPY by 3 to 6 percentage points. However, closed ETFs are not included, so looking only at the results of products that survived introduces an upward bias.
This study differs from the four regularities in both coverage and period, so it was not aggregated into a common performance figure.
Using this study to read other trading methods
First, separate the price-movement pattern from after-cost profit. Before costs, overnight annualized returns were higher than intraday returns in every decade, but the after-cost profit from trading every day was small. This did not show an advantage over buy-and-hold. Next, check whether the test looked at the period after the paper's sample, and whether it showed intervals and not only averages. Even when an average is positive, as with FOMC here, the difference may not be clearly established.
Finally, look at your own capital size and cost conditions. For methods with a minimum commission, a smaller starting capital cannot be expected to produce the same annualized return. When assessing protection against declines, both maximum drawdown and whole-episode gains or losses need to be checked.
Remaining limitations
- Even where results look weaker after publication, we did not test the causal claim that they disappeared because they were published.
- The overnight test is one form: trading the full amount of SPY every day. Approaches such as trading less often, using futures, or changing cost conditions cannot be judged from these results.
- Taxes, exchange and regulatory fees, deviations of execution prices from the open and close, and interest on idle cash are not included. The effect on the results, and on the pass judgments, of including them was not tested in this calculation. Actual spreads in the 1990s may have been wider than 1bp.
- On 159 of SPY's 8,288 days, the open was the same as the previous close, and this was not corrected. The split between overnight and intraday may be off by a few days a year.
- The IPO test is an approximation that uses mechanically selected candidates and treats about 25 days after listing as the brokerage's research start date. It does not establish actual IPO dates or analyst publication dates, and the result is conditioned on the deals that could be observed.
- Past one-time tests with different coverage and periods were neither summed nor averaged. In actual trading, costs and execution conditions would differ.
This article is an edited version of research results from 2026-10. It does not recommend trading any specific product, and it does not guarantee future profits.